
In the experiment, we measure the two continuous characters which are associated with each other. For example, the height of the plant and the temperature of the atmosphere. Accordingly, to understand the relationship between two such variables, we need to know how they are related and how the relationship can be expressed in a visual form.
Correlation
The statistical technique to determine the relationship or association between two quantitative variables is called correlation. In other words, it determines the relationship between two quantitative variables. However, it does not prove that one particular variable causes the change in the other.
Correlation coefficient
In correlation coefficient, we measure the degree of the relationship between two sets of figures in terms of another parameter. A simple correlation coefficient is denoted by the letter “r”. In addition, it is known as Pearson’s correlation or product-moment correlation coefficient. For population coefficient, we use the Greek letter “ρ”. Its pronunciation is “rho”. Certainly, the absolute value of r remains constant irrespective of change of origin.
The extent of correlation varies between minus one and plus one (-1 ≤ r ≤ 1). The value is in a fraction with a positive or negative sign.
Best safe and secure cloud storage with password protection
Get Envato Elements, Prime Video, Hotstar and Netflix For Free
Best Money Earning Website 100$ Day
#1 Top ranking article submission website
- The sign of “r” denotes the nature of the association.
- The value of “r” denotes the strength of the association.
Type of Correlation
It is common to use a scatter diagram as a visual representation of data. We can show on a graph paper by plotting each pair of variables (X and Y). Consequently, placing a dot at the point corresponding to the values of X and Y.
Perfect Positive Correlation
- The two variables are directly proportional. In other words, fully correlate with each other.
- The correlation coefficient (r) is +1.
- Both variables rise or fall at the same proportion.
- The graph forms a straight line from the lower ends of the X and Y-axis.
- When we draw a scatter diagram, all points fall on this straight line.
Perfect Negative Correlation
- The two variables are inversely proportional to each other.
- The correlation coefficient (r) is -1.
- When one variable rises, the other variable falls at the same proportion.
- The graph will show a straight line from either of the extreme ends.
- When we draw a scatter diagram, all points fall on this straight line.
Moderately or Partially Positive Correlation
-
The two variables are moderately proportional to one another.
- The correlation coefficient (r) = 0 < r < 1.
- The variables are moderately proportional. i.e. They rise and fall in a similar proportion.
- The graph forms an imaginary line from the lower ends of both the X and Y-axis.
- When we draw a scatter diagram, the points will scatter around an imaginary mean line.
Moderately or Partially Negative Correlation
- The two variables are moderately inversely proportional to each other.
- The correlation coefficient (r) = -1< r< 0.
- The variables are moderately proportional. i.e. when one variable rises, the other variable falls at a similar proportion.
- The graph forms an imaginary line from either of the extreme ends.
- When we draw a scatter diagram, the points will scatter around an imaginary mean line.
Absolutely No Correlation
- The two variables have no association with each other.
- The correlation coefficient (r) = 0
- Both the variables rise or fall independently.
- The graph shows no imaginary line. Therefore, no trend of correlation.
- When we draw a scatter diagram, the points will be much scattered.
Calculation of Correlation coefficient
This calculation is introduced by Professor Karl Pearson. It is used to determine the direction and degree of the linear relationship between two variables. The variables must be normally distributed for this method to be applied.
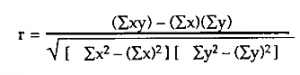
Formula:
Where numerator indicates variability between two variables.
Hypothesis testing from Pearson Correlation
As we carry out an experiment and take observations from the sample, the observed value of “r” has to be tested for significance. The following formula is for the calculation of a small sample. We set up null-hypothesis as:
Ho = There is no significant relationship between dependent and independent variables.
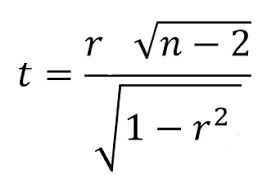
Formula:
where the degrees of freedom = n-2.
Regression
We use regression analysis to describe the relationships between a set of independent variables and the dependent variable. Regression analysis produces a regression equation. Moreover, the coefficients represent the relationship between each independent variable and the dependent variable. Therefore, it enables the user to predict the values of one variable on the basis of the other variable. For instance, on the positive or negative side, beyond the mean. Francis Galton coined the term “regression” in the nineteenth century. He described a biological phenomenon through regression.
Regression coefficient
The regression coefficient is denoted by the letter “b”. It shows the gradient or slope of the straight line of correlation. Moreover, it can calculate the equation for a straight line in correlation (Y= a+bX).
Formula: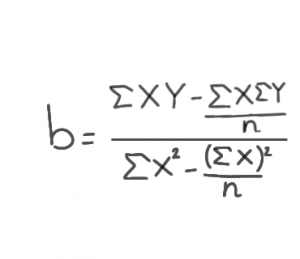
Plotting Graph
The calculated b is placed into the equation. Consequently, “a” is a constant for Y-intercept. We can find by subtracting the product of regression coefficient and mean of X from the mean of Y:
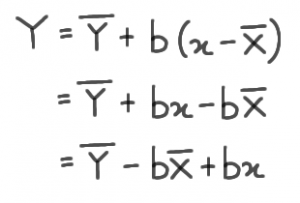
Finally, we plot a straight line. Place the value of X and Y. The lines will go through the points.
Reference:
- Mahajan’s Methods in Biostatistics for Medical Students and Research Workers- page 219-269.
- Notes from Regression analysis and correlation by Prof. Rakha Hari Sarker.
- pictures from here


Your point of view caught my eye and was very interesting. Thanks. I have a question for you.