
Objectives of this articleTo understand
|
Read the next part of this article: Introduction to Biostatistics part 2
Statistics
Statistics is defined as a body of processes for creating reasonable and wise decisions in the face of uncertainty. These are applied in the analysis of numerical data of various aspects including interpretation of data based on certain statistical principles.
Statistics is a field of study involving techniques or methods of collecting data, classification, summarizing, interpretation, drawing, inferences, testing of hypotheses, making recommendations, etc. only when a part of data is used.
Biostatistics or Biometry
Biostatistics is the term referred to when tools of statistics are applied to the data that is derived from biological sciences. In other words, when the principles of statistics are applied to the study of organisms or living systems, the study is called biostatistics or biometry.
It encompasses the design of biological experiments, especially in medicine, pharmacy, agriculture, and fishery; the collection, summarization, and analysis of data from those experiments; and the interpretation and inference from the obtained results.
Scope of Statistics
- In Physiology and Anatomy
- To define normal or healthy in a population and find limits of normality in variables such as weight & pulse rate.
- To find the difference between means and proportions of normal at two places or in different periods. The mean height of Bangladeshi boys is less than the mean height of American boys. Whether this difference is due to chance or a natural variation or because of some other factors such as better nutrition playing a part, has to be decided.
- To find the correlation between two variables X and Y such as height & weight. Whether weight increases or decreases proportionately with height & if so by how much has to be found.
- In Pharmacology
- To find the action of a drug. For example, a drug given to animals or humans to see whether the changes produced are due to drug or by chance
- To compare the action of two different drugs or two successive dosages of the same drug.
- To find the relative potency of a new drug for a standard drug.
- In Medicine
- To compare the efficacy of a particular drug, operation, or line of treatment. For example, the percentage cured, relieved, or died in the experiment & control groups is compared & the difference due to chance or otherwise is found by applying the statistical technique.
- An appropriate test is applied for this purpose to find an association between two attributes such as cancer & smoking.
- To identify signs & symptoms of a disease or syndrome. Cough in typhoid is found by chance and fever is found in almost every case. The proportional incidence of one symptom or another indicates whether it is a characteristic feature of the disease or not.
- In Community Medicine & Public Health
- To test the usefulness of vaccines in the field – the percentage of attacks or deaths among the vaccinated subjects is compared with that among the non-vaccinated ones to find whether the difference is observed as statistically significant.
- In epidemiological studies – the role of causative factors is statistically tested. The deficiency of iodine as an important cause of goiter in a community is confirmed only after comparing the incidence of goiter cases before and after giving iodized salt.
Reference
- Mahajan BK 2002 (Methods in Biostatistics) (6th edition)
- Zaman SM, HK Rahim and M Howlader 1982. (Simple Lessons from Biometry), BRRI
- Class Note.
Variable
In statistical language, any character, characteristic, or quality that varies is called a variable.
A characteristic that takes on different values in different persons, places, or things such as height, weight, blood pressure, age, etc is variable. It is denoted usually as “x”. Variables can be of two types: Categorical & Numerical variables.
Characteristics
- Variable is usually represented by x. Such as x1 x2 x3 ……… xn, where the number of variables is n and the individual variable is x.
- Variation is created due to genetic recombination.
- Variation can be caused by both artificial and natural mutations.
Random variable
A random variable is a variable whose value is a numerical outcome of a random phenomenon. For example: Flip three coins and let x represent the number of heads. Here, x is a random variable.
A random variable is not a probability. Its value doesn’t need to be positive or between 0 and 1 as in the case of probability.
Numerical variables are divided into two categories:
- Qualitative or Discrete Data or, Variable
- Quantitative or Continuous Data or, Variable
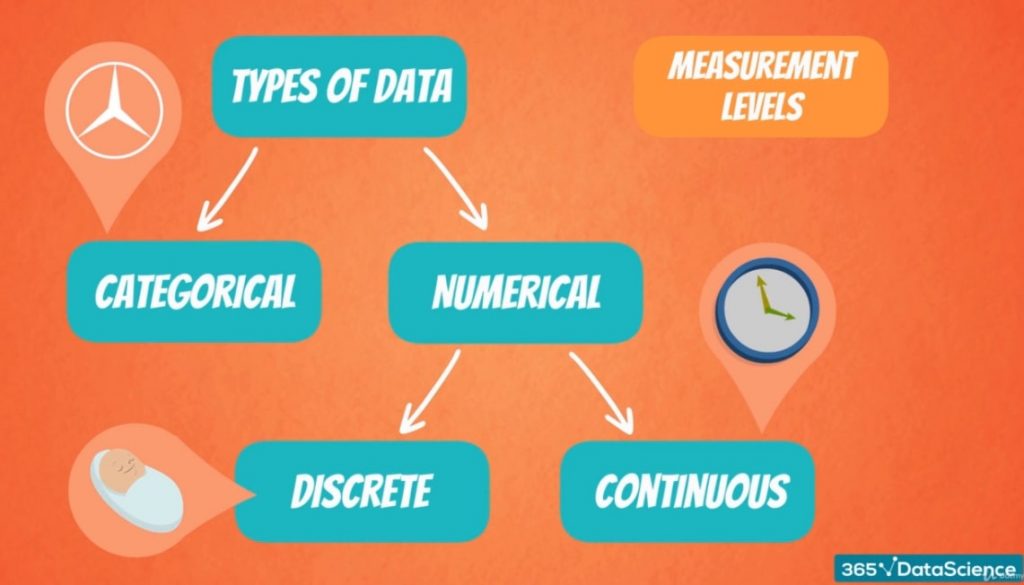
Qualitative or Discrete Data or, Variable
Qualitative Data are classified by counting the individuals or things having the same characteristic or attribute; and not by measurement. Examples:
- The number of cars in a parking lot,
- Number of quarters in a purse, jar, or bank,
- Ages on birthday cards (always in discrete numbers like 21 years old) etc.
Individuals with the same characteristics are counted to form specific groups or classes.
Qualitative data are discrete, such as the number of deaths in different years, the population of different towns, and persons with different blood groups in a population.
Characteristics
- Discrete variables have no continuity. So, they are also called qualitative variables.

Quantitative or Continuous Data or, Variable
A continuous variable is a variable that has an infinite number of possible values. In other words, any value is possible for the variable.
A continuous variable doesn’t have to have every possible number (like -infinity to +infinity), it can also be continuous between two numbers, like 1 and 2. For example, data of a discrete variable could be 1, 2 while the continuous variables could be 1, 2 and also everything or anything in between: 1.00, 1.01, 1.001, 1.0001…
Examples
- The time it takes a computer to complete a task,
- A person’s weight,
- Age etc.
The weight of students from 2nd year are (in kg) 40.9, 45, 55, 50.1, 53, 54, 54, 48, 48.5, 46, 70, 85, 82, 83.1, 62.5 etc.(See how the number varies within a range)
In the case of quantitative/continuous data, there are two variables- the characteristics such as height & frequency. We find the characteristic, as well as the frequency both, vary from person to person as well as from group to group.
The quantitative data obtained from characteristic variables (e.g. height of individuals in 2nd year) are called continuous data because each individual has one measurement from a continuous spectrum or range.
Some of the statistical methods employed in the analysis of quantitative data are mean, range, standard deviation, coefficient of variation, etc.

References
- Mahajan BK 2002. (Methods in Biostatistics) (6th Edition)
Revised by
- Noushin Sharmili Suzana on 22nd October 2021.


yes
Your article gave me a lot of inspiration, I hope you can explain your point of view in more detail, because I have some doubts, thank you.
Can you be more specific about the content of your article? After reading it, I still have some doubts. Hope you can help me.